The circuit in the previous article (Figs 1-2) uses a stepper motor as its 'slip memory', or 'phase accumulator'. Each step represents one cycle of phase slippage. The aggregate slippage is represented by the number of steps noted by a pointer connected to a stepper motor shaft, pointing to a scale, after some time has elapsed. The only other input needed to calculate the stability of the oscillator under test is the elapsed time in seconds - the test's stop time minus its start time.
The computer offers a way to automate the process for long-term testing. Since I have a computer here that runs 24/7 (the computer that hosts this website), I decided to build an interface and write some software to do the number crunching.
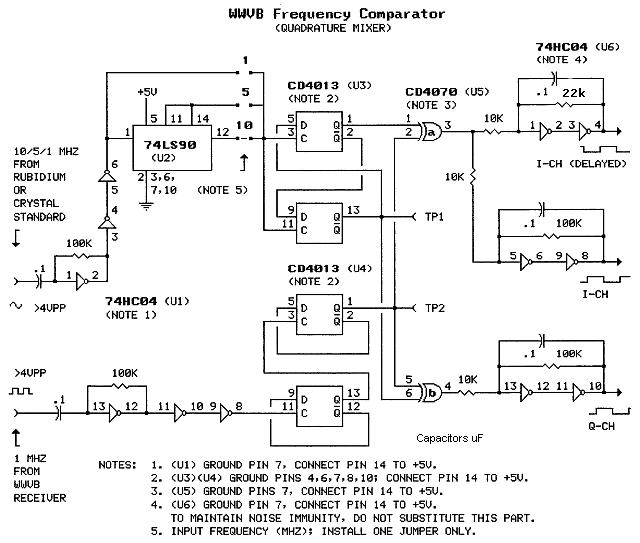
The two figures below show the comparator schematic with the computer interface added (Figure 4), along with a slightly modified quadrature mixer circuit (Figure 3).
(Figure 3)
(Figure 4)
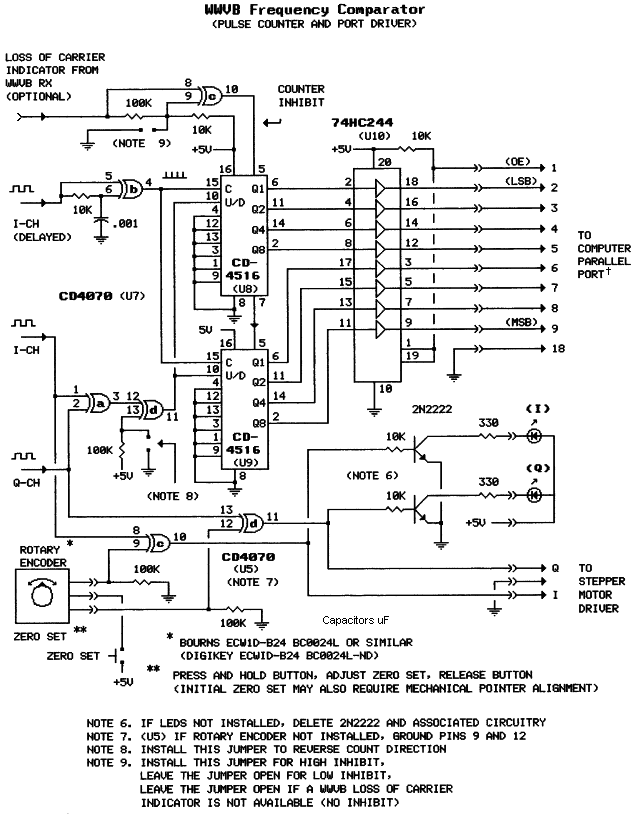
The interface (Fig 4) consists of two cascaded CD4516 4-bit binary up/down counters, together comprising an 8-bit binary up/down counter, and a 74HC244 line-driver. The 8 output lines from the line driver connect, through a parallel printer cable, to the computer's parallel I/O port. (The parallel port was used to connect a printer in computing's olden days.) The OE (output enable) line delivers a signal from the computer telling the comparator when it's ready to accept data. When the OE line goes low, the line driver outputs are enabled.
The counter is the 'first-order' counter of the system. It keeps track of the pulses from the quadrature mixer. Note that there are two inputs to the counter, analogous to the two inputs to the stepper motor. One input is called 'clock' (C). The counter registers a count each time the clock signal goes from low to high. The other is "up/down" (U/D). It tells the counter what direction to count, high up, low down.
The clock signal is derived from a separate filter/Schmitt trigger gate, shown in Figure 3, called the "delayed" I-channel. (See: LP Filter/Schmitt Trigger*) The delayed I-channel gate is designed with a wider hysteresis band than the I-channel gate below it (note the 22k resistor in leau of 100k across the feedback capacitor).
The delayed I-channel signal is further processed by U7b which generates a clock pulse on both the rising and falling edges. The counter is clocked on every other step of the stepper motor, thus the effective sample rate is 500 kHz. The result of these two processing steps is to assure that the clock signal cannot change state before the U/D signal changes state, thus assuring that one and only one count will be registered for each cycle slip.
The U/D signal is generated by combining the I-channel and Q-channel signals in U7a. The signal is inverted (or not inverted) by U7d so as to generate counts in the positive direction for positive phase slips (or negative direction if selected by a jumper to ground on pin 13).
Note that there is some ambiguity built into the counter. After it reaches full count, binary 11111111 (dec 255), on the next (up) clock pulse the counter reverts back to 00000000, registering a huge step backward. Likewise, when the counter reaches 00000000, on the next (down) clock pulse it jumps to 11111111, registering a huge step forward. To keep the hardware simple, the ambiguity is dealt with in the software.
The WWVB receiver provides a "loss of carrier" indicator output line. A low on this line indicates when the carrier from WWVB is not present or is of low quality (low S/N). This signal is used to inhibit the counter during loss of carrier intervals, preventing it from accumulating spurious counts.
The section below presents the real-time data now being collected by the computer connected to the WWVB Frequency Comparator, along with their evaluation.
Phase Slippage Data Evaluation
Device under test: modified Hewlett-Packard 10544A ovenized crystal oscillator
Accumulated Phase Slippage and Time Data:
At scheduled intervals the web server calls up a program which reads the output from the WWVB frequency comparator via the computer's parallal port and appends the current data byte to an accumulator file. The oldest entry in the accumulator file is thrown out. The accumulator collects 25 successive data and time readings. For the current test, the slippage data are being read automatically once every hour (3600 seconds) and may also be read manually more often.
The URL for this page calls up a program (wwvb_computerized.php) that displays the contents of the accumulator file and calculates frequency error from the data. The error is the derivative of the phase slips over time:
Frequency Error* = dNφ/dt,
where:
dN is the number of phase slips,
φ is the phase error represented by each slip in seconds,
and dt is elapsed time in seconds.
*More commonly called Offset from Nominal, or just Offset.
Each 1-point change in the slip data represents 360 degrees (one cycle) of phase slippage at 500 kHz, the frequency at which the two sources (the WWVB receiver and the source under test) are compared. Thus each slip represents 1/500000 second (2 µS) of phase error. The frequency error calculation becomes:
Frequency Error = dN x 1/500000 x 1/dt.
The table below shows the last 25 raw data outputs from the frequency comparator (in decimal format) along with the times the data were recorded. The latest entry, recorded/calculated within the last hour, is at the bottom.
| Phase Slip Count, N | dN | Computer Time, t (seconds) | dt (seconds) | dN x 1/500000 x 1/dt Parts/109(rounded) |
| 23 | - | 1784536560 | - | - |
| 23 | 0 | 1784540160 | 3600 | 0 |
| 23 | 0 | 1784543760 | 3600 | 0 |
| 23 | 0 | 1784547360 | 3600 | 0 |
| 24 | 1 | 1784550960 | 3600 | 0.6 |
| 25 | 1 | 1784554560 | 3600 | 0.6 |
| 27 | 2 | 1784558160 | 3600 | 1.1 |
| 29 | 2 | 1784561760 | 3600 | 1.1 |
| 31 | 2 | 1784565360 | 3600 | 1.1 |
| 34 | 3 | 1784568960 | 3600 | 1.7 |
| 38 | 4 | 1784572560 | 3600 | 2.2 |
| 41 | 3 | 1784576160 | 3600 | 1.7 |
| 45 | 4 | 1784579760 | 3600 | 2.2 |
| 49 | 4 | 1784583360 | 3600 | 2.2 |
| 54 | 5 | 1784586960 | 3600 | 2.8 |
| 58 | 4 | 1784590560 | 3600 | 2.2 |
| 63 | 5 | 1784594160 | 3600 | 2.8 |
| 67 | 4 | 1784597760 | 3600 | 2.2 |
| 72 | 5 | 1784601360 | 3600 | 2.8 |
| 78 | 6 | 1784604960 | 3600 | 3.3 |
| 82 | 4 | 1784608560 | 3600 | 2.2 |
| 88 | 6 | 1784612160 | 3600 | 3.3 |
| 93 | 5 | 1784615760 | 3600 | 2.8 |
| 96 | 3 | 1784619360 | 3600 | 1.7 |
| 100 (latest entry) | 4 | 1784622960 | 3600 | 2.2 |
get current reading
24-Hour Calculation:
Phase Slips (dN) (latest entry minus oldest entry) = 77
Elapsed Time (dt) (latest entry minus oldest entry) = 86400 seconds
Calculated Offset (dN x 1/500000 x 1/dt) = 1.7824074074074E-009
Frequency Error, Parts in 1011 (rounded) = 178.2
Frequency Error (offset from nominal) @:
1 MHz = 0.001782 Hz
5 MHz = 0.008912 Hz
10 MHz = 0.01782 Hz
24-Hour Record:
Expanded Phase Slip Count (N) - 24-Hour Graph
The hourly phase slip data for the last 24 hours are displayed on the graph below.
- This is an expanded graphical representation of the information shown in the left column of the table above - phase slip count (N).
- Vertical Scale: The center number, on the red graticule line, shows the 24-hour average phase slip count. The numbers above and below the red line show deviation from average.
- Horizontal Scale: Hour #
- The latest point (#24) was recorded/calculated within the last hour.
Violent excursions are usually caused by your experimenter manually adjusting the device under test or otherwise fooling with the test setup.
31-Day Records:
12-Hour Average Phase Slip Count (N) and Correction Voltage - 31-Day Graph
Twice-daily average phase slip and correction voltage (if applicable) data are shown on the graph below. The plot shows the trend over 31 days. Its flatness (or lack of) is an indication of the intrinsic stablility of the oscillator.
- This is another representation of the step information shown in the left column above.
- Phase slip count is averaged [(N1 + N2 + ... + N12)/12] and plotted at 12 hour intervals.
- Left Vertical Scale: Average absolute phase slip count.
- Right Vertical Scale: Controller correction voltage. This voltage is produced by the frequency controller shown in the third article of this series and correlates directly to the phase slip count. The voltage is significant only if the controller is being used to correct the oscillator under test. (The controller is currently being used to correct the oscillator under test. )
- Horizontal Scale: Day #
- The latest point (#31) was recorded/calculated within the last 12 hours.
Violent excursions are usually caused by your experimenter manually adjusting the device under test or otherwise fooling with the test setup.
Frequency - 31-Day Graph
Twice a day, frequency error is calculated and plotted on the graph below. 31 days worth of error data are shown.
- Vertical Scale: Parts per 1011
- Horizontal Scale: Day #
- The latest point (day #31) was calculated within the last 12 hours.
The bottom line:
Frequency - Calculated 31-Day Offset
157.87037/1011
When the oscillator under test is being disciplined by the controller, the frequency offset averaged over a long period of time will approach zero.
back
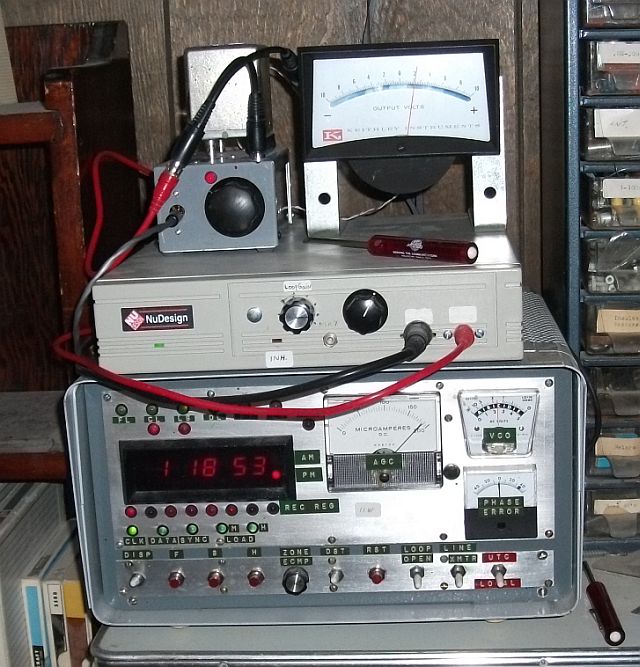
Photo
HP10544A/Analog Voltmeter
Comparator
WWVB Receiver
Schematics produced with DCCAD.
top↑
(Do not collect $200.)
